
Diverse Data Initiative: Genomics England

I was invited to collaborate with Genomic England’s Diverse Data initiative, an initiative that aims to reduce health inequalities and improve patient outcomes within genomic medicine.
I created three drawings of where possible data gaps can arise in a dataset, where these data gaps can potentially fuel health inequality.
I started by thinking of visual metaphors (modelling clay, sieves, spotlights, piles of objects) that draw on common experiences and objects in the physical world. Using visual metaphors drawn from the ‘real’ world around us takes the slippery, hard-to-define nature of a data gap and gives it a concrete, physical form, making it able to be understood more easily.
This way of working with (but not working with) data has convinced me of the value of incorporating subjective art practices within a rigorous research space, as through the act of drawing visualising data from a different angle, these drawings can function as conversation starters for researchers as they solidify their formal research and communicate it to a wider audience.

Data bias arising from data that is unable to be disaggregated
This drawing communicates how bias can arise from data that is unable to be disaggregated, thus removing opportunities to possibly gain insights about a minority group merged within the aggregated data.
In the drawing, many strands of disaggregated, multicoloured data points are being collected by a study, where they travel down a funnel that slowly compresses these data points into a solid mass (an aggregated dataset).
The visual metaphor I’ve used to communicate this is of multicoloured modelling clay, where when different colours are mixed and compressed, they can’t be unmixed.

Data bias arising from the questions a study chooses to ask
This drawing communicates how bias can arise from the questions that one chooses to ask and answer through data analysis, as if you ask a question that mainly serves the majority population the study results may offer less impact for a minority group.
The visual metaphor I’ve used to communicate this is of a shining spotlight. The study’s main question functions as a sort of 'spotlight' / 'view' upon a dataset, where a question will 'shed light' and illuminate insights for a specific part of the population.
In the drawing, a bold spotlight representing the study’s chosen question shines mainly over the majority population, leaving the minority group ‘in the dark’. In the background, spotlights with dotted lines represent other possible study questions that researchers could have chosen to ask/include that could potentially shed more light on a minority population, either through asking broad questions that answer questions for an entire population, or by asking questions specifically targeted towards the minority population.
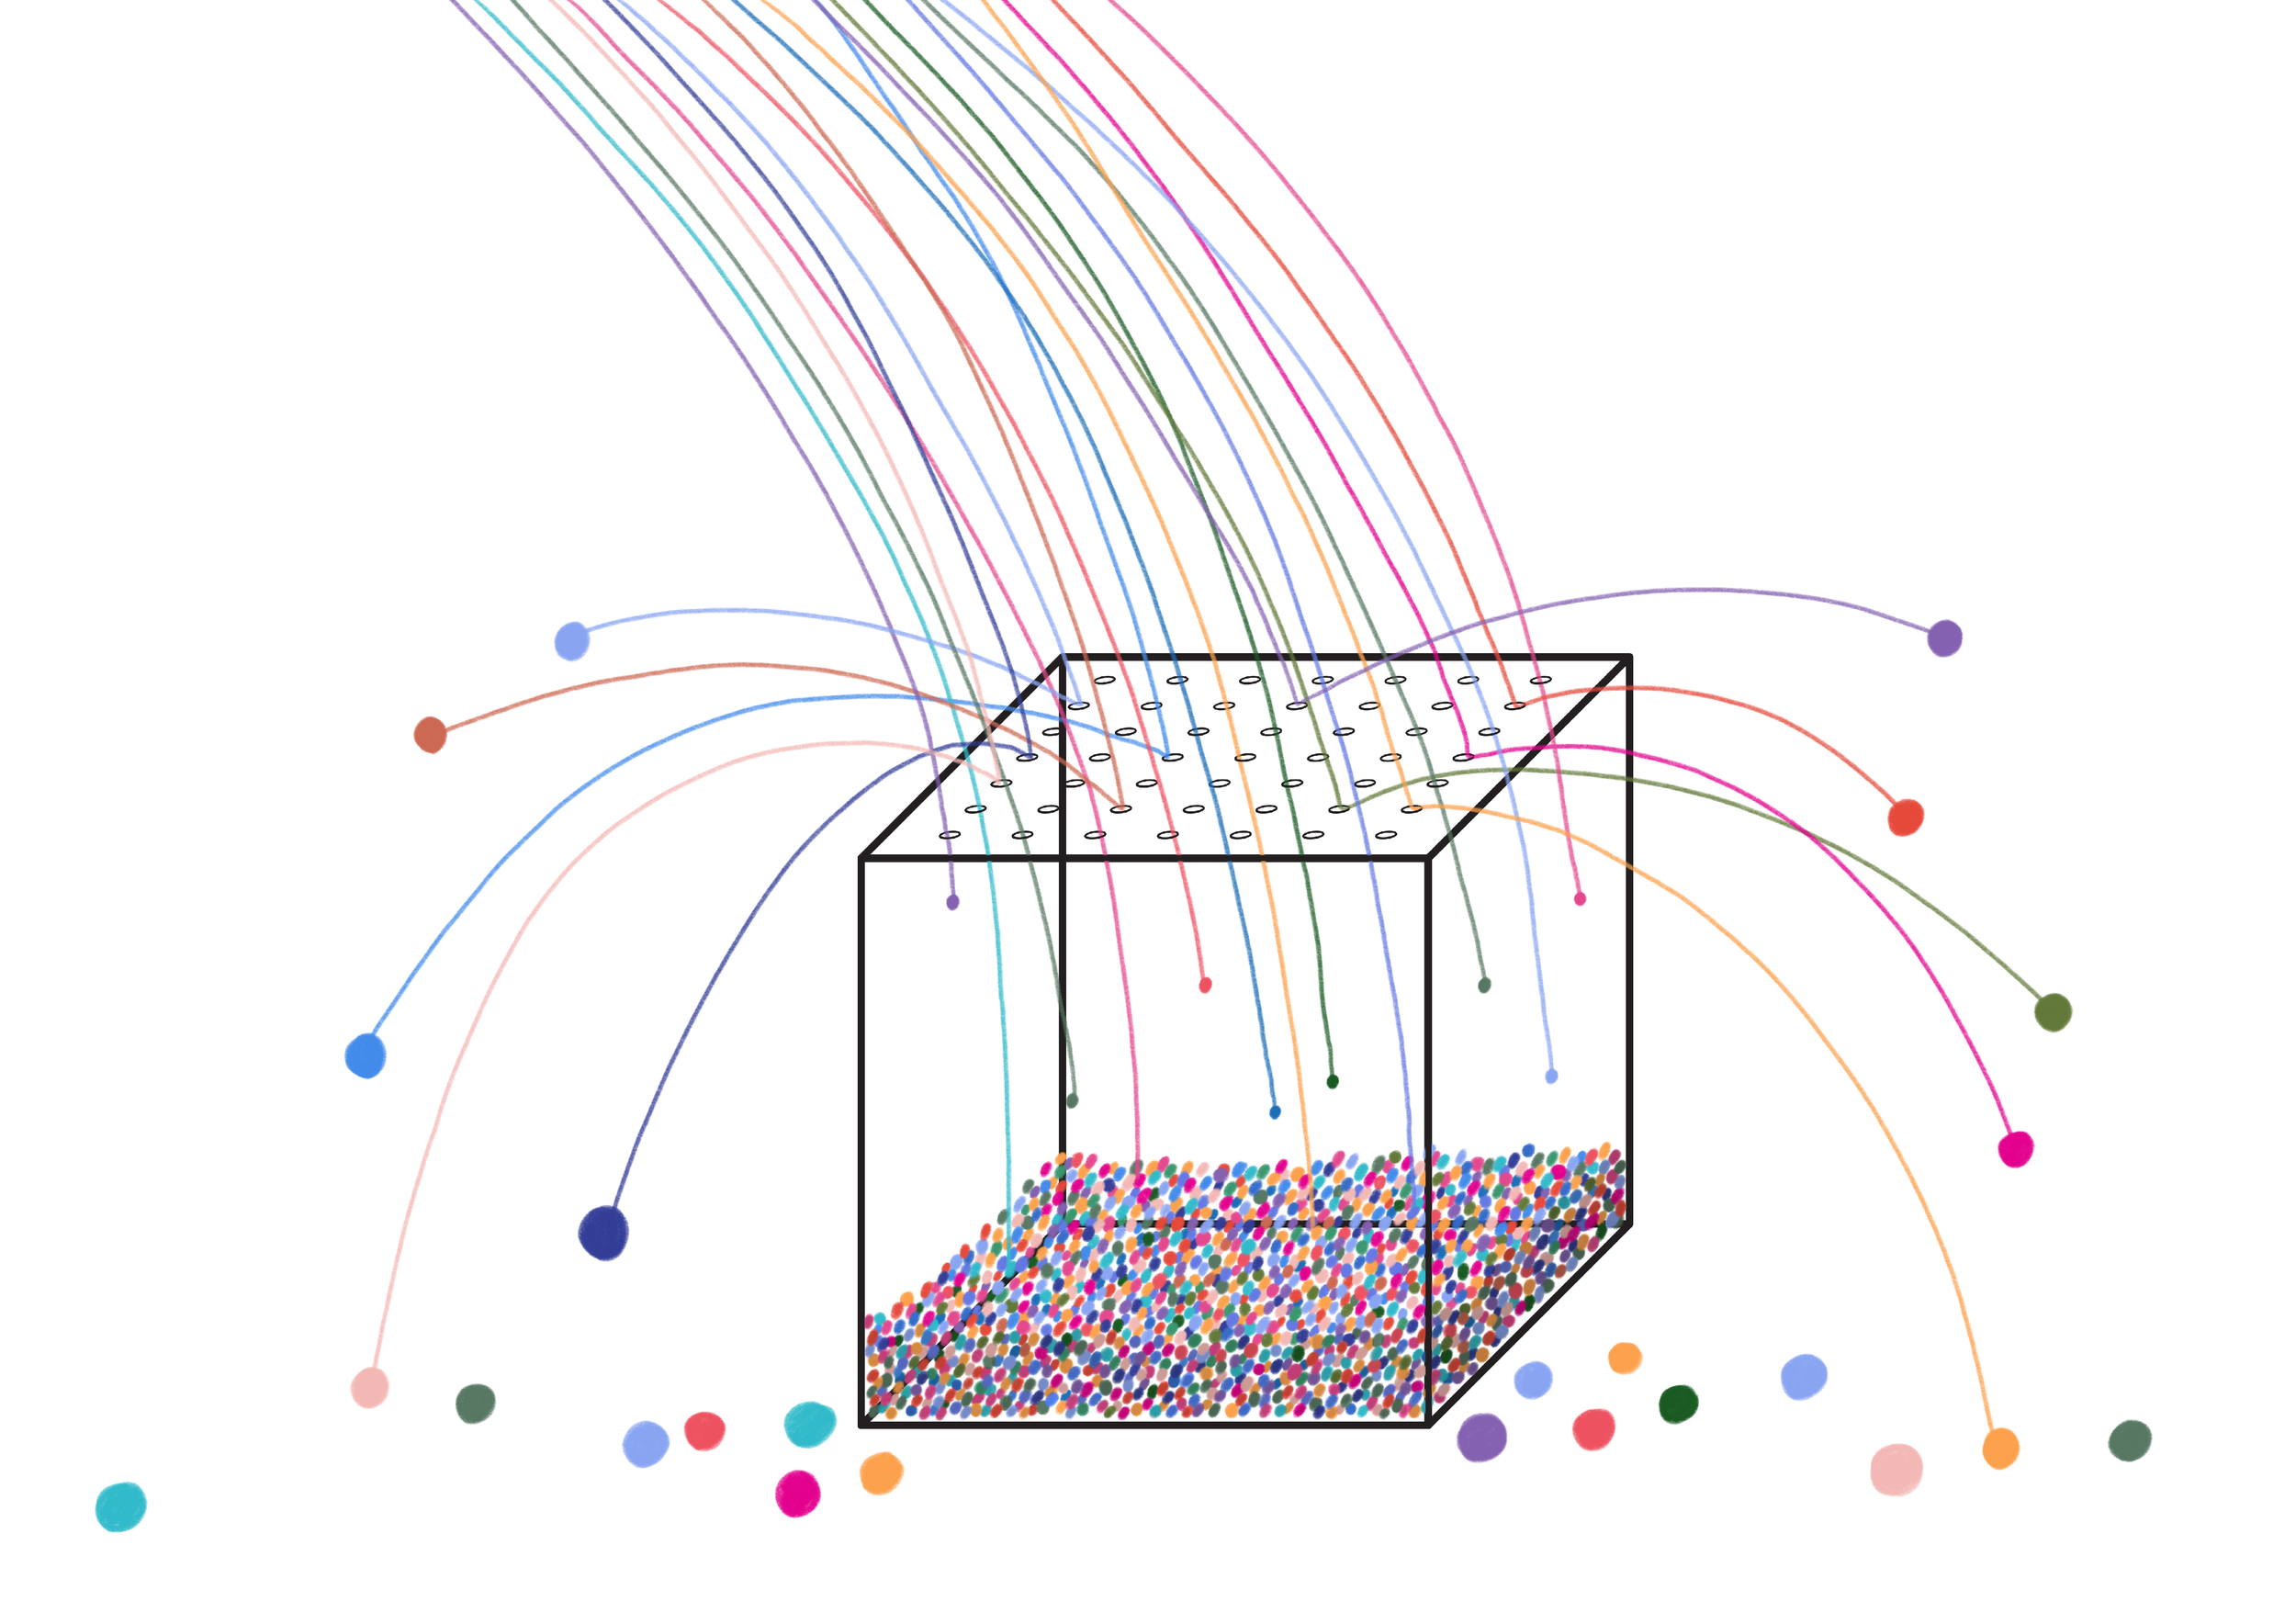
Data bias arising from data architectures that are not fit for purpose
This drawing communicates how data bias can arise from data architectures not designed in a way that accommodates the data collection needs of a specific population, where some of their data might not 'fit' the architecture. In this scenario, data gaps occur if the mismatch of data architecture to population means the data is relegated to a less precise, messier part of the data structure (for example, is placed in the catch-all category ‘other’ instead of having a specific location) or not collected whatsoever.
In the drawing, data points are dropping into a data structure. Data points of a specific shape and size fit neatly through the structure’s holes and are collected in a tidy manner. Data points that are too large for the structure’s hole don’t fit and so bounce and scatter around the outside of the structure in chaotic fashion.
The visual metaphor used in this drawing alludes to sieves, colanders, and shape sorting toys, where all have been designed to have specific sized and shaped holes that only allow certain types of elements to pass through their structures.