Data Empathy Workshop: Abu Dhabi Child Data Symposium
When faced with large statistics about human suffering, how can we still feel compassion for the ‘people behind the numbers’?
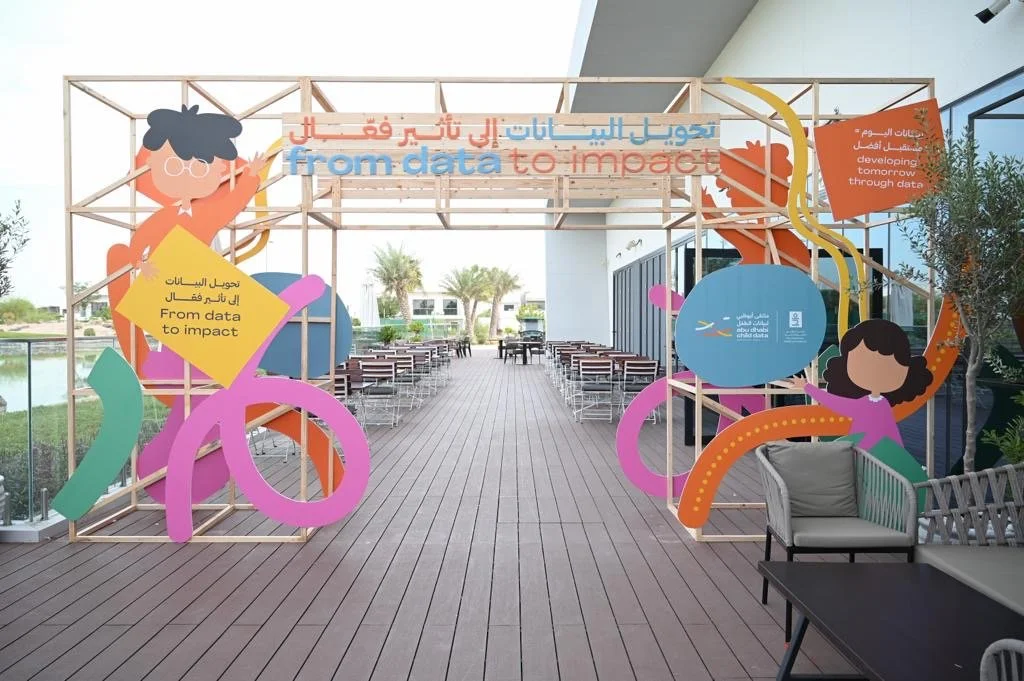
I explored this in a workshop at the Abu Dhabi Child Data Symposium, hosted by its Early Childhood Authority. I was asked to design a workshop that would communicate these statistics in an emotional, impactful way – to inspire change and improve early childhood outcomes in Abu Dhabi.
I based the workshop on ‘psychic numbing’ – a cognitive bias explored in Numbers and Nerves that makes us indifferent to large-scale suffering, leading to inaction in crises like famine, climate change or war.
One way to combat this is to imagine the individual behind the number and make the statistic physical and visible so people can confront its scale.
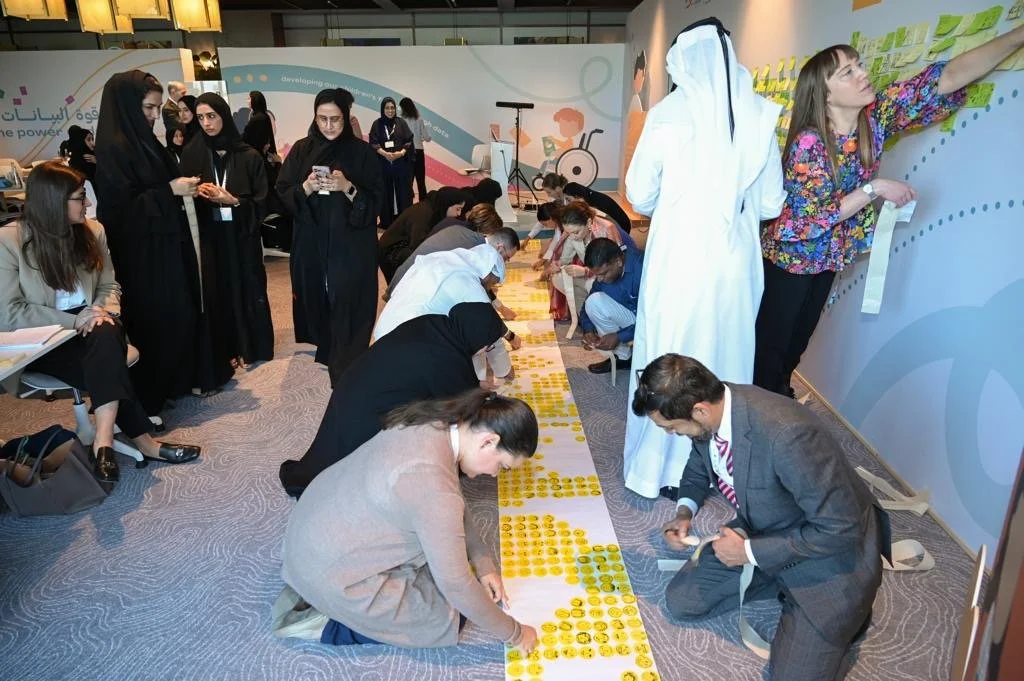
Using this approach, the audience created physical visualisations of two ‘mystery’ infant mortality statistics – moving the numbers from abstraction to physicality. Participants imagined the lives, stories and struggles of the individuals behind each number. Once each visualisation was complete, the statistic was revealed – connecting the imagined families and children with the actual numbers to strengthen compassion for the children and families behind these statistics and inspire change.
Feedback about the session’s emotional impact was heartening. As people had imagined their own children or families when creating the different components of the visualisations, the statistic ‘reveal’ created a quiet emotional response.
This feedback shows how even lo-fi data experiences are make the lives behind ‘faceless’ numbers feel real and memorable.
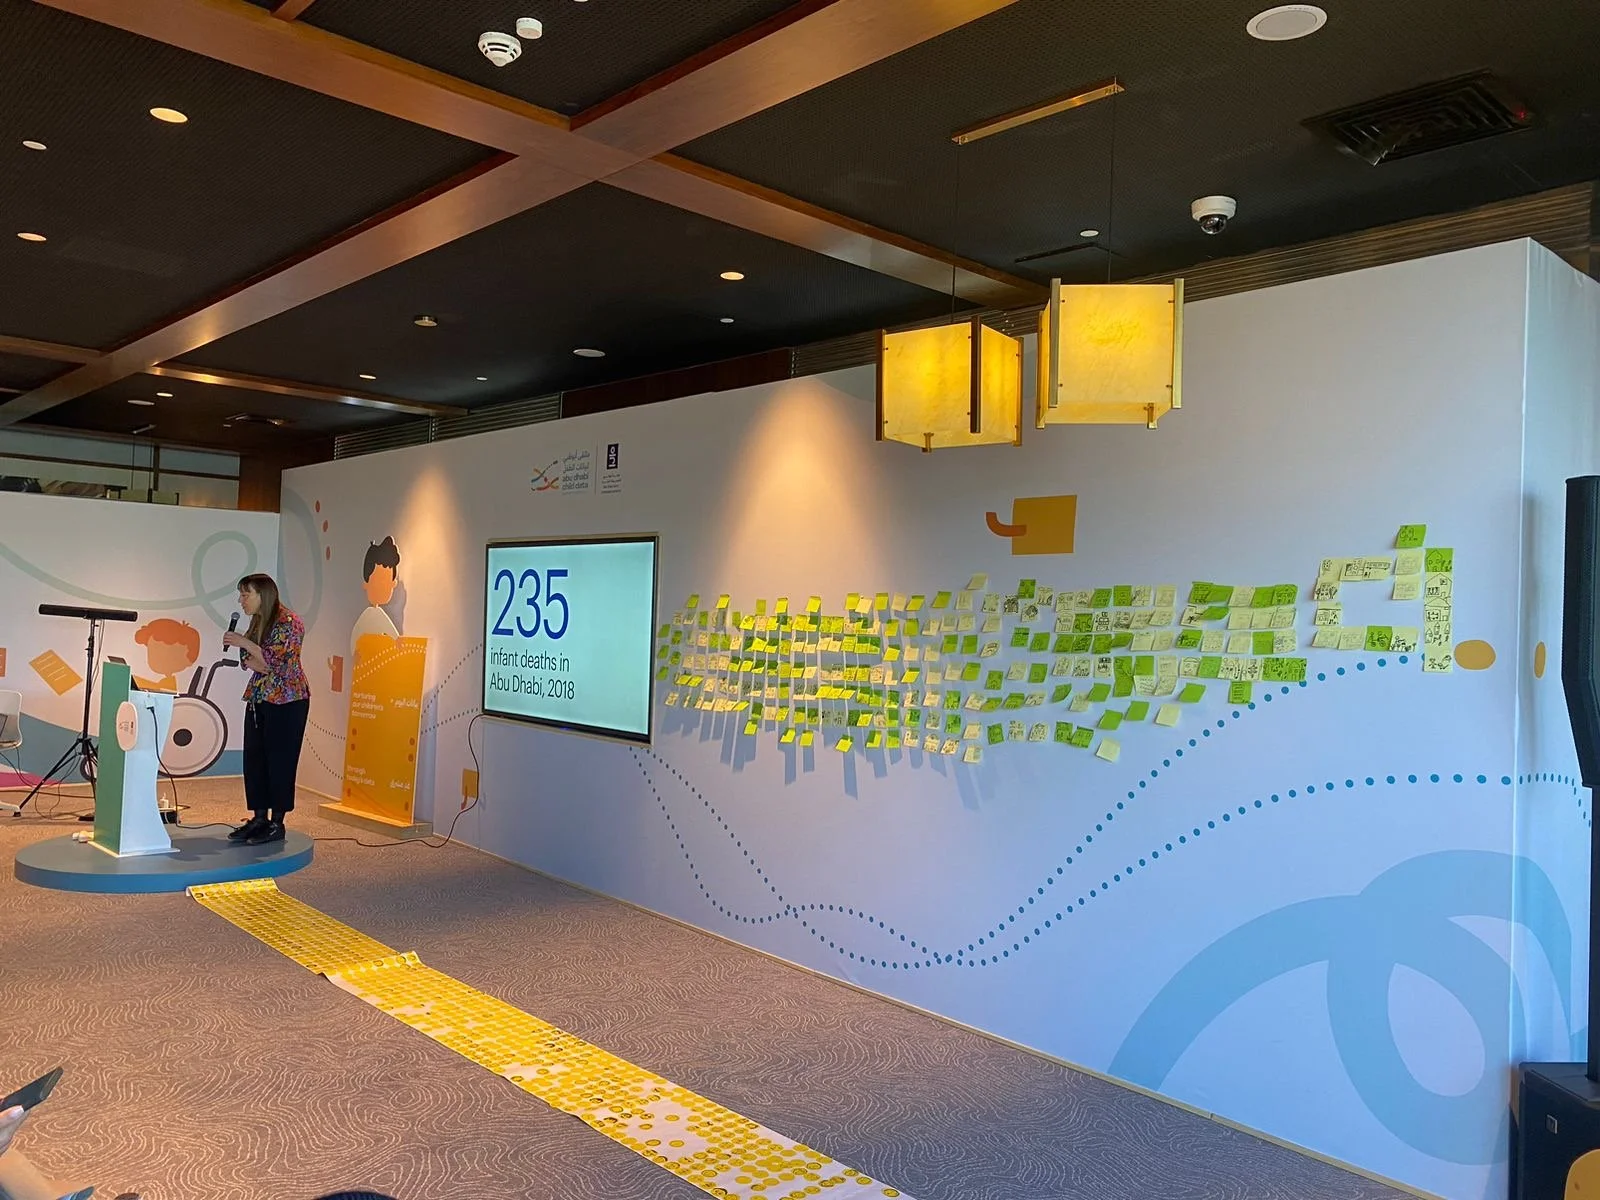
Statistic 01: Total infant deaths in Abu Dhabi, 2018
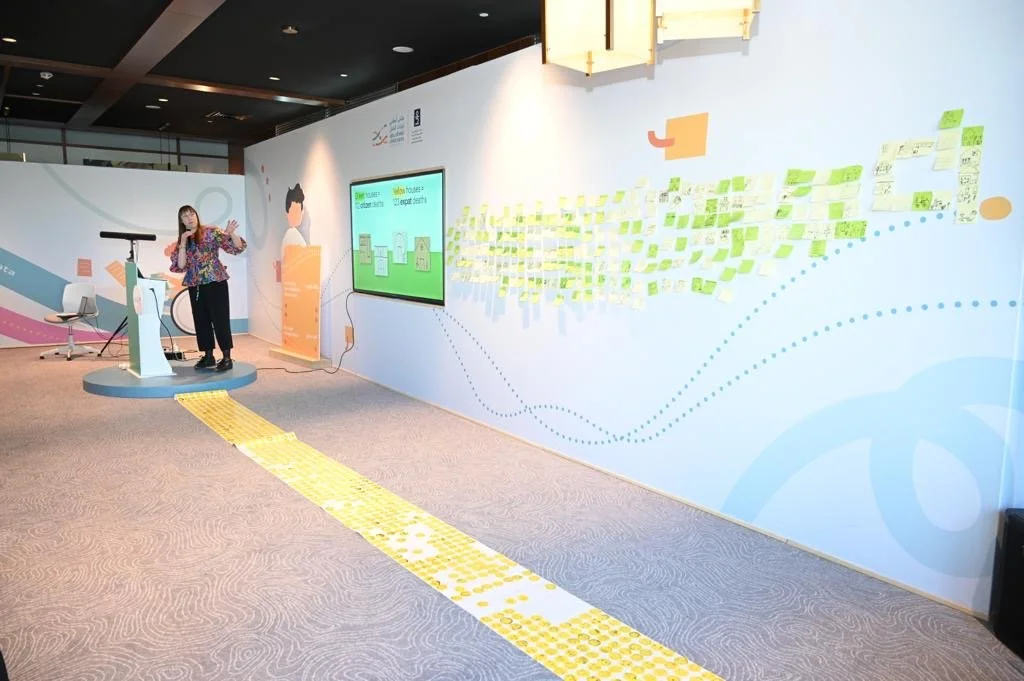
Participants drew domestic scenes on coloured Post-its, each representing an Abu Dhabi household. These were brought together to form one large data visualisation. When complete, I revealed the statistic: they had collectively created the same number of households that suffered the death of an infant in Abu Dhabi in 2018.


Statistic 02: Abu Dhabi infant mortality rate, 2018
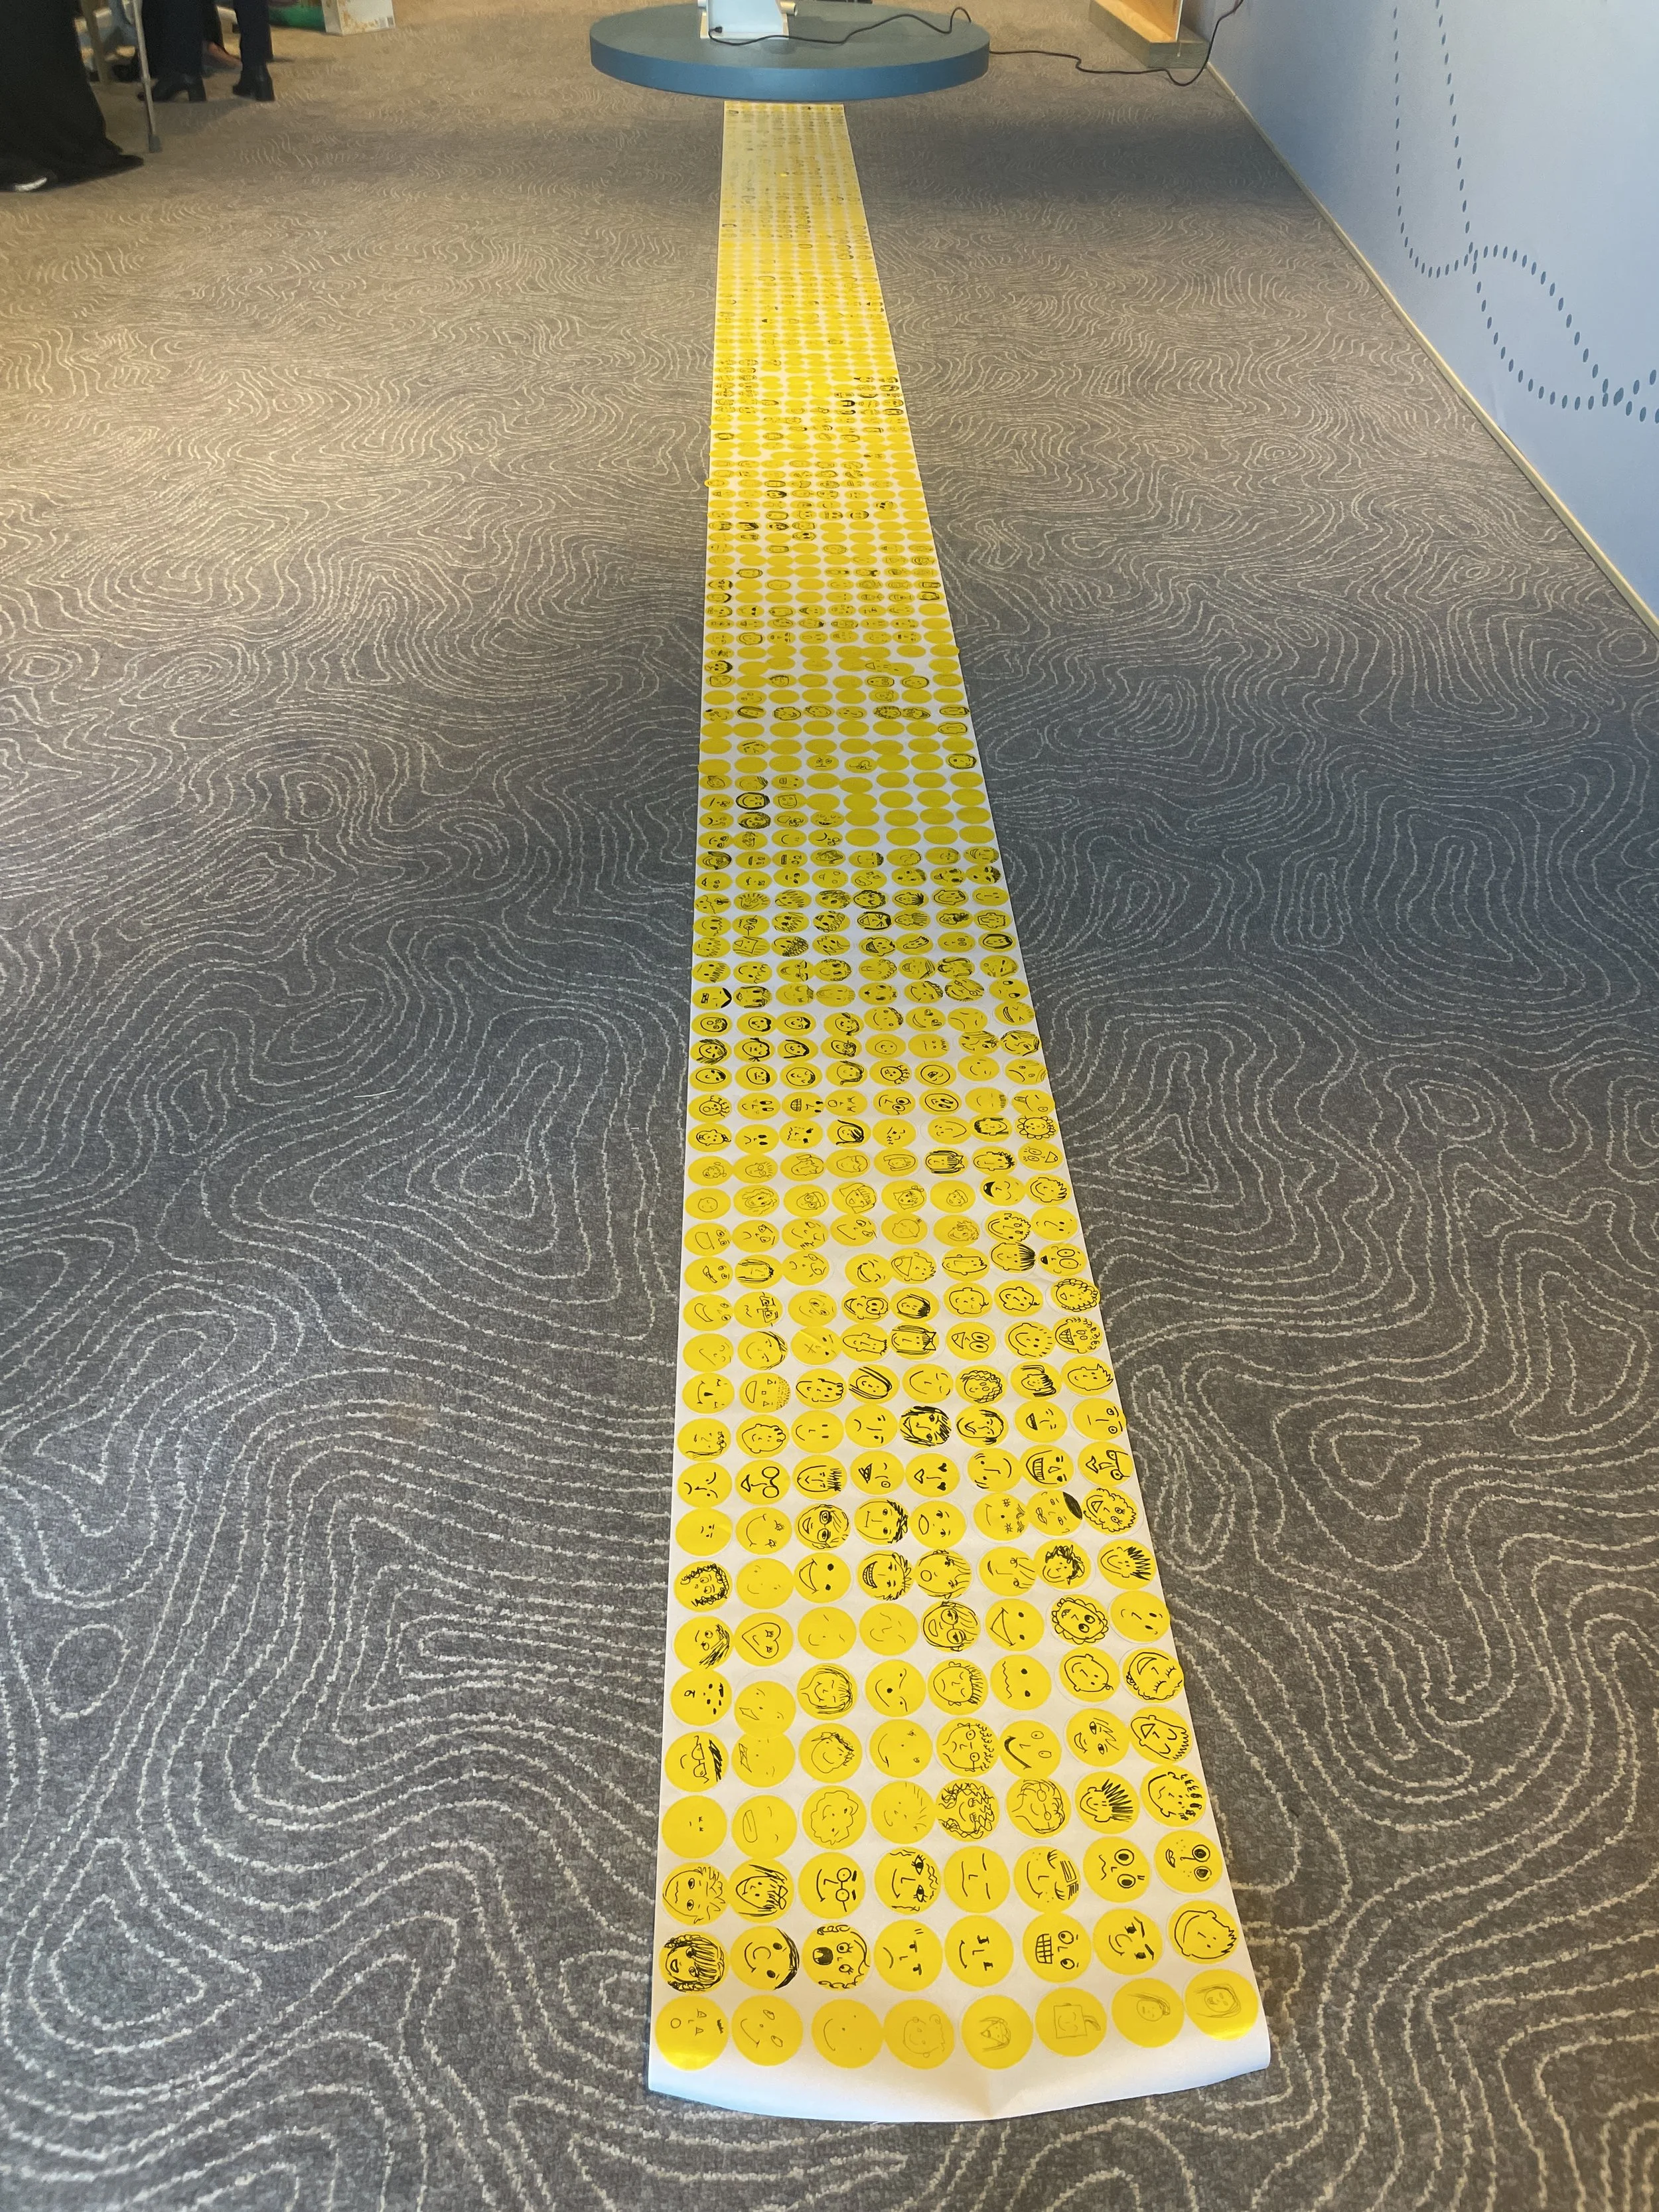
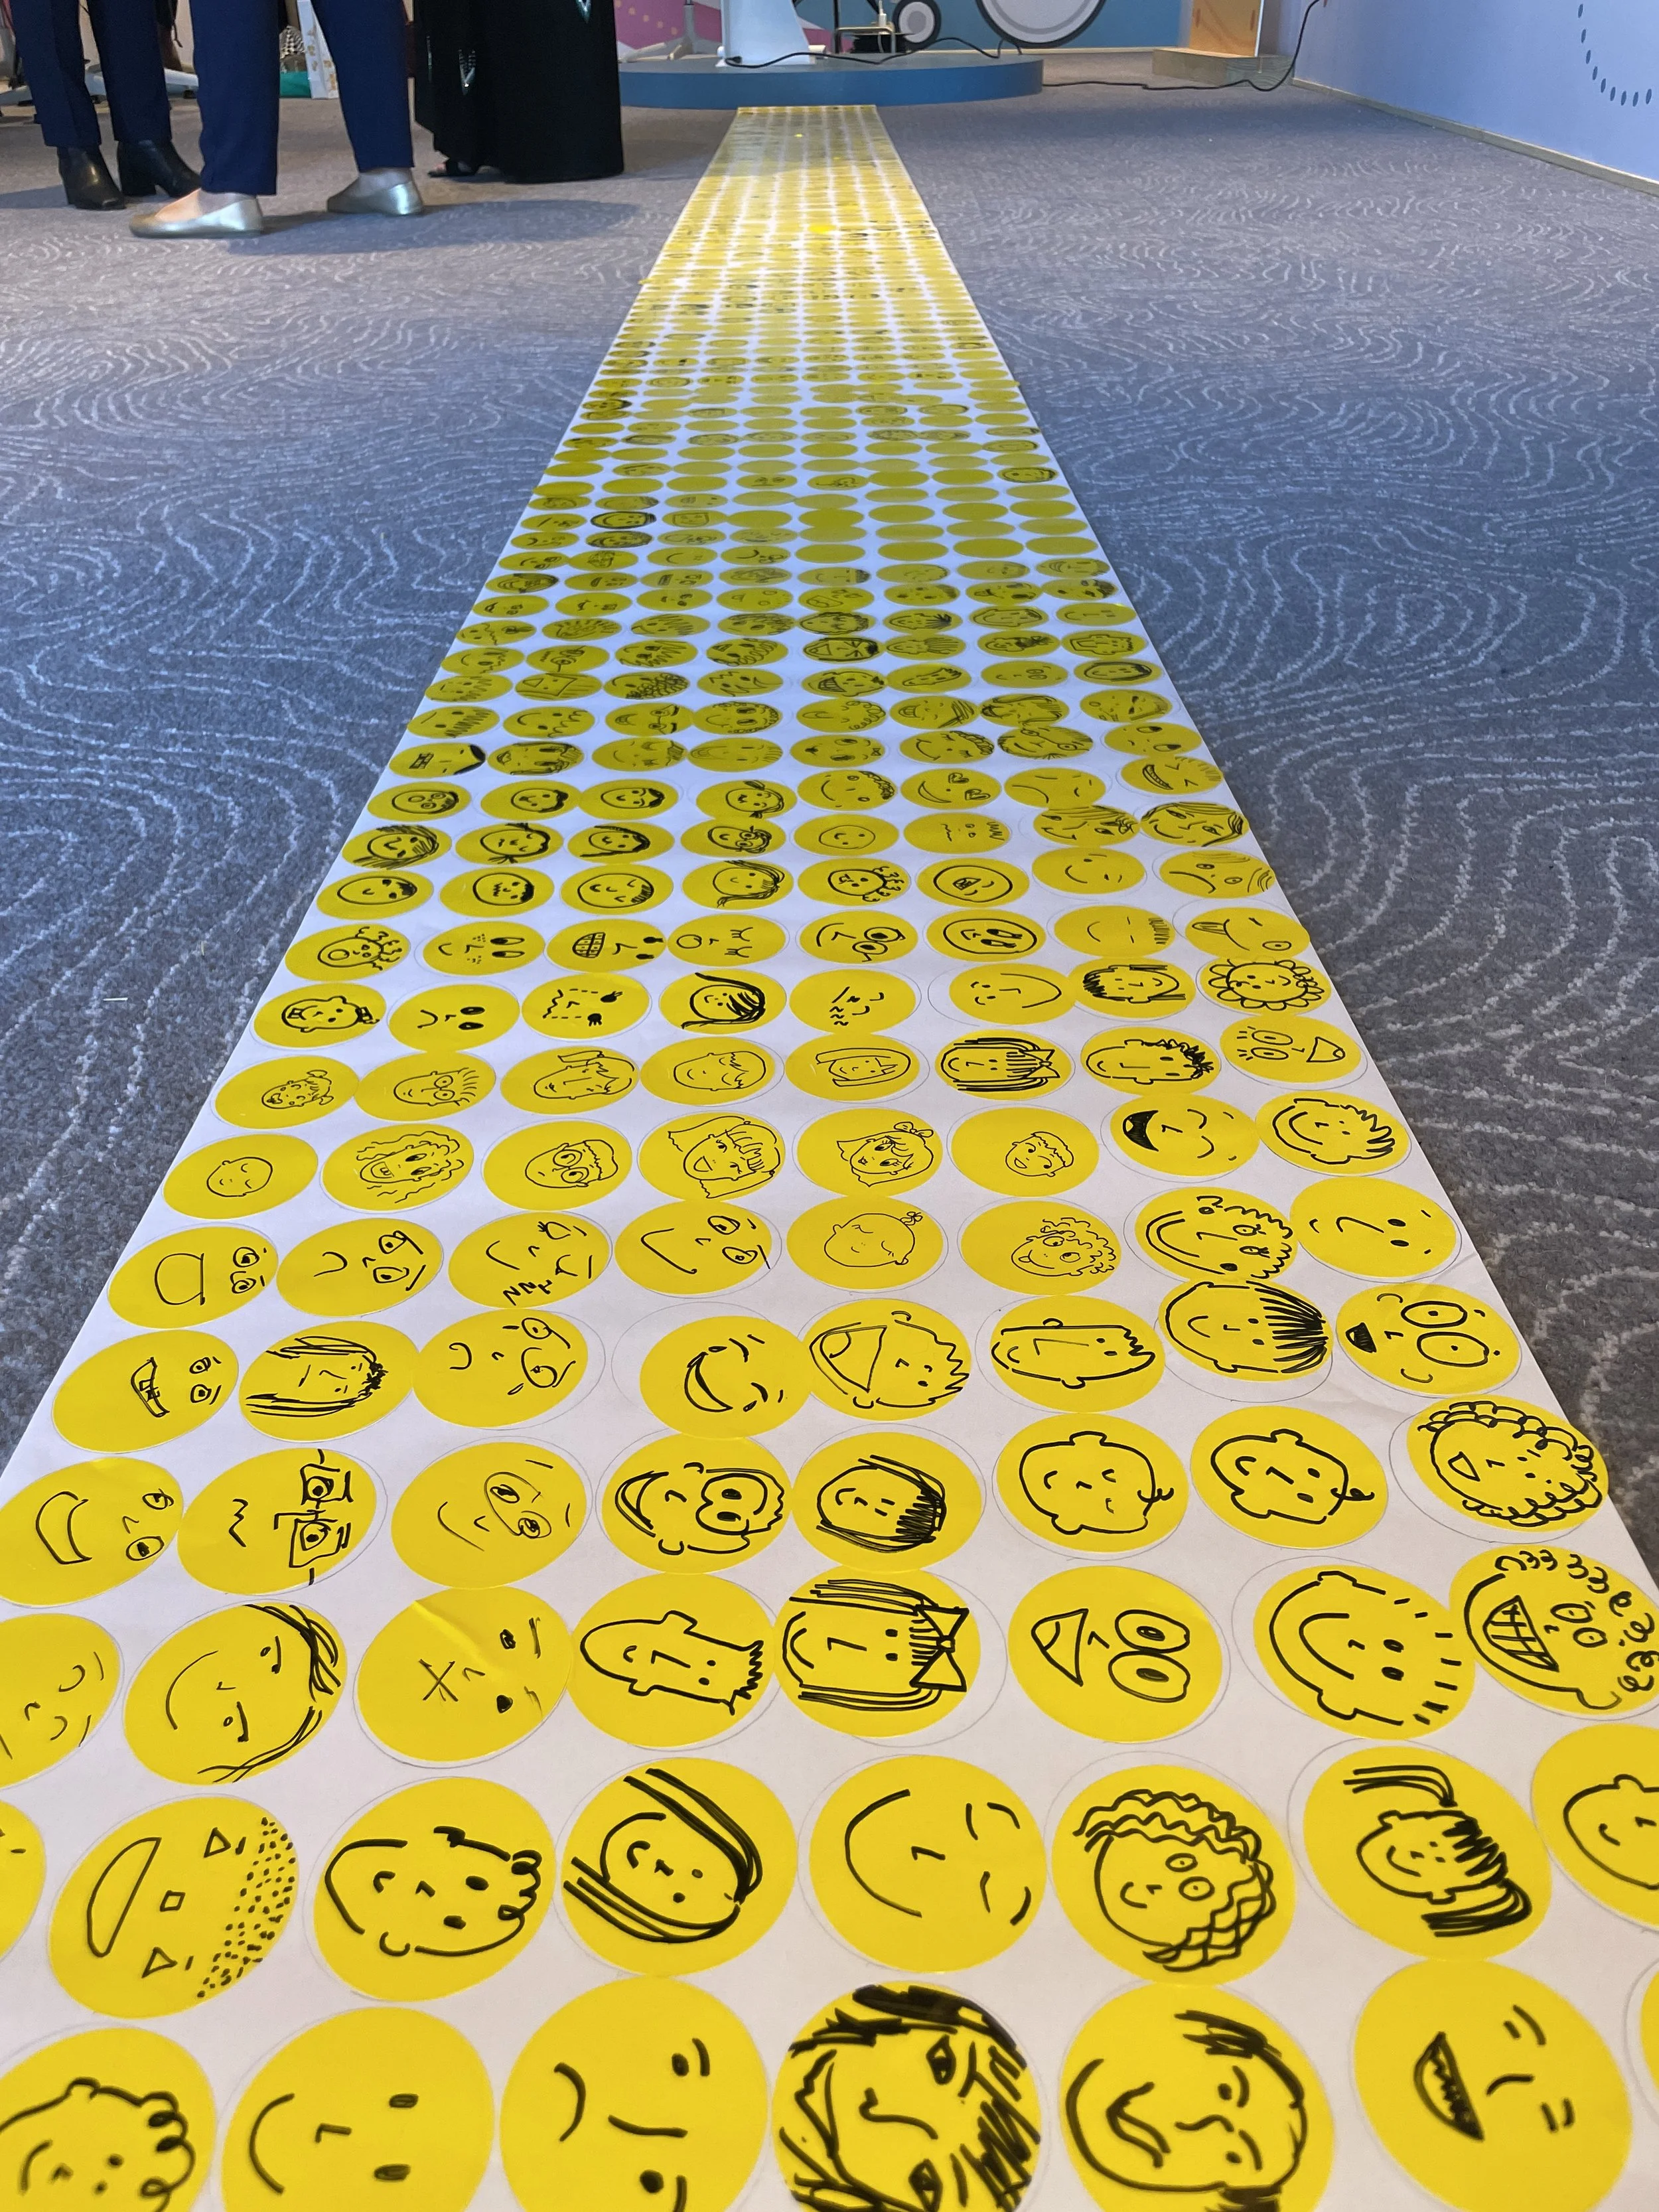
Next, participants were given yellow stickers and asked to draw the face of a child, imagining their personality. These were added to a long roll of paper, becoming 1,000 ‘children’.
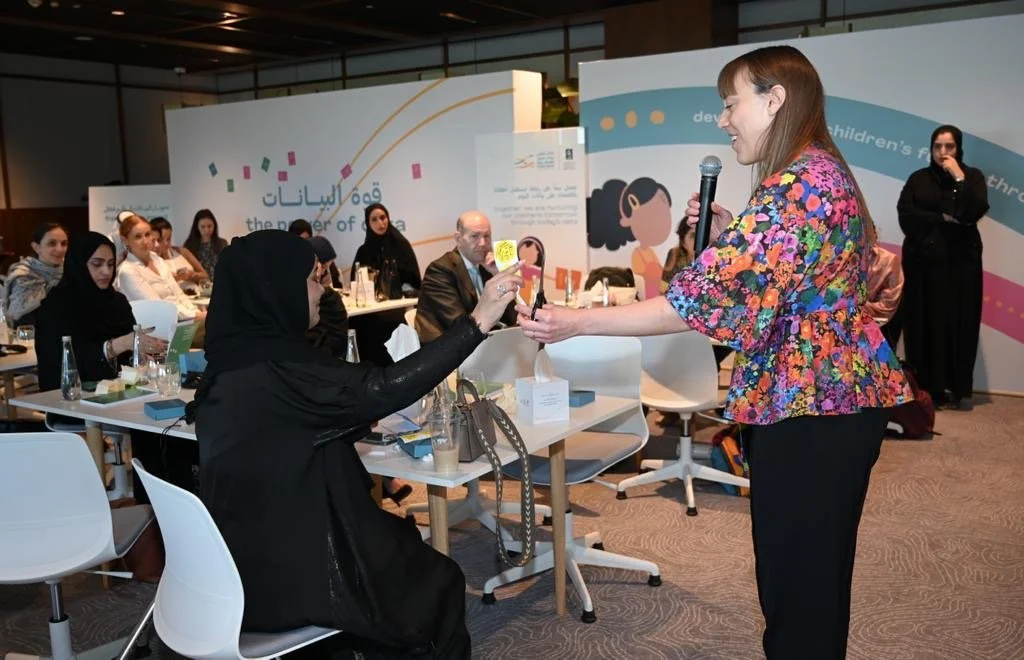
I revealed the statistic by using scissors to cut away stickers, first showing Finland's mortality rate (one of the lowest global mortality rates), then Abu Dhabi’s (much higher). I then handed the ‘children’ representing these rates to an attendee to look after and protect: a reminder of the ECA's mission.
The attendee who looked after the ‘children’ representing the infant mortality rate said she felt responsible for them – especially since it included stickers she had created with characteristics of her own children.